User Retention with Lness using PostgreSQL and Superset
I’m currently working on an early stage startup, seeking to maximize user retention. They’re generally interested in easy to understand metrics like daily active users (DAU) A common metric that venture capitalists have been looking for is called Lness, which is defined as
For a given user, their Lness classifier is defined as the number of days in the last n-days in which they engaged with the app.
If n is 7 (the last week), and a user opened the app 5 times on Monday, 10 times on Wednesday, and 1 time on Saturday, then their Lness is a 3. The amount of activity on a given day does not matter, so long as it’s non-zero. The Lness will be an integer between 0 to n.
Engage is ambiguous, and depends on what your app’s key activities are; is it that they open the app? watch a video? like someone’s status update? In the case below, I have an event stream table, which could come from Segment or Amplitude or something home grown, and I define engagement as any user-driven action. If you have offline events in this table (such as an events fired from scheduled drip campaigns), you’ll want to exclude these.
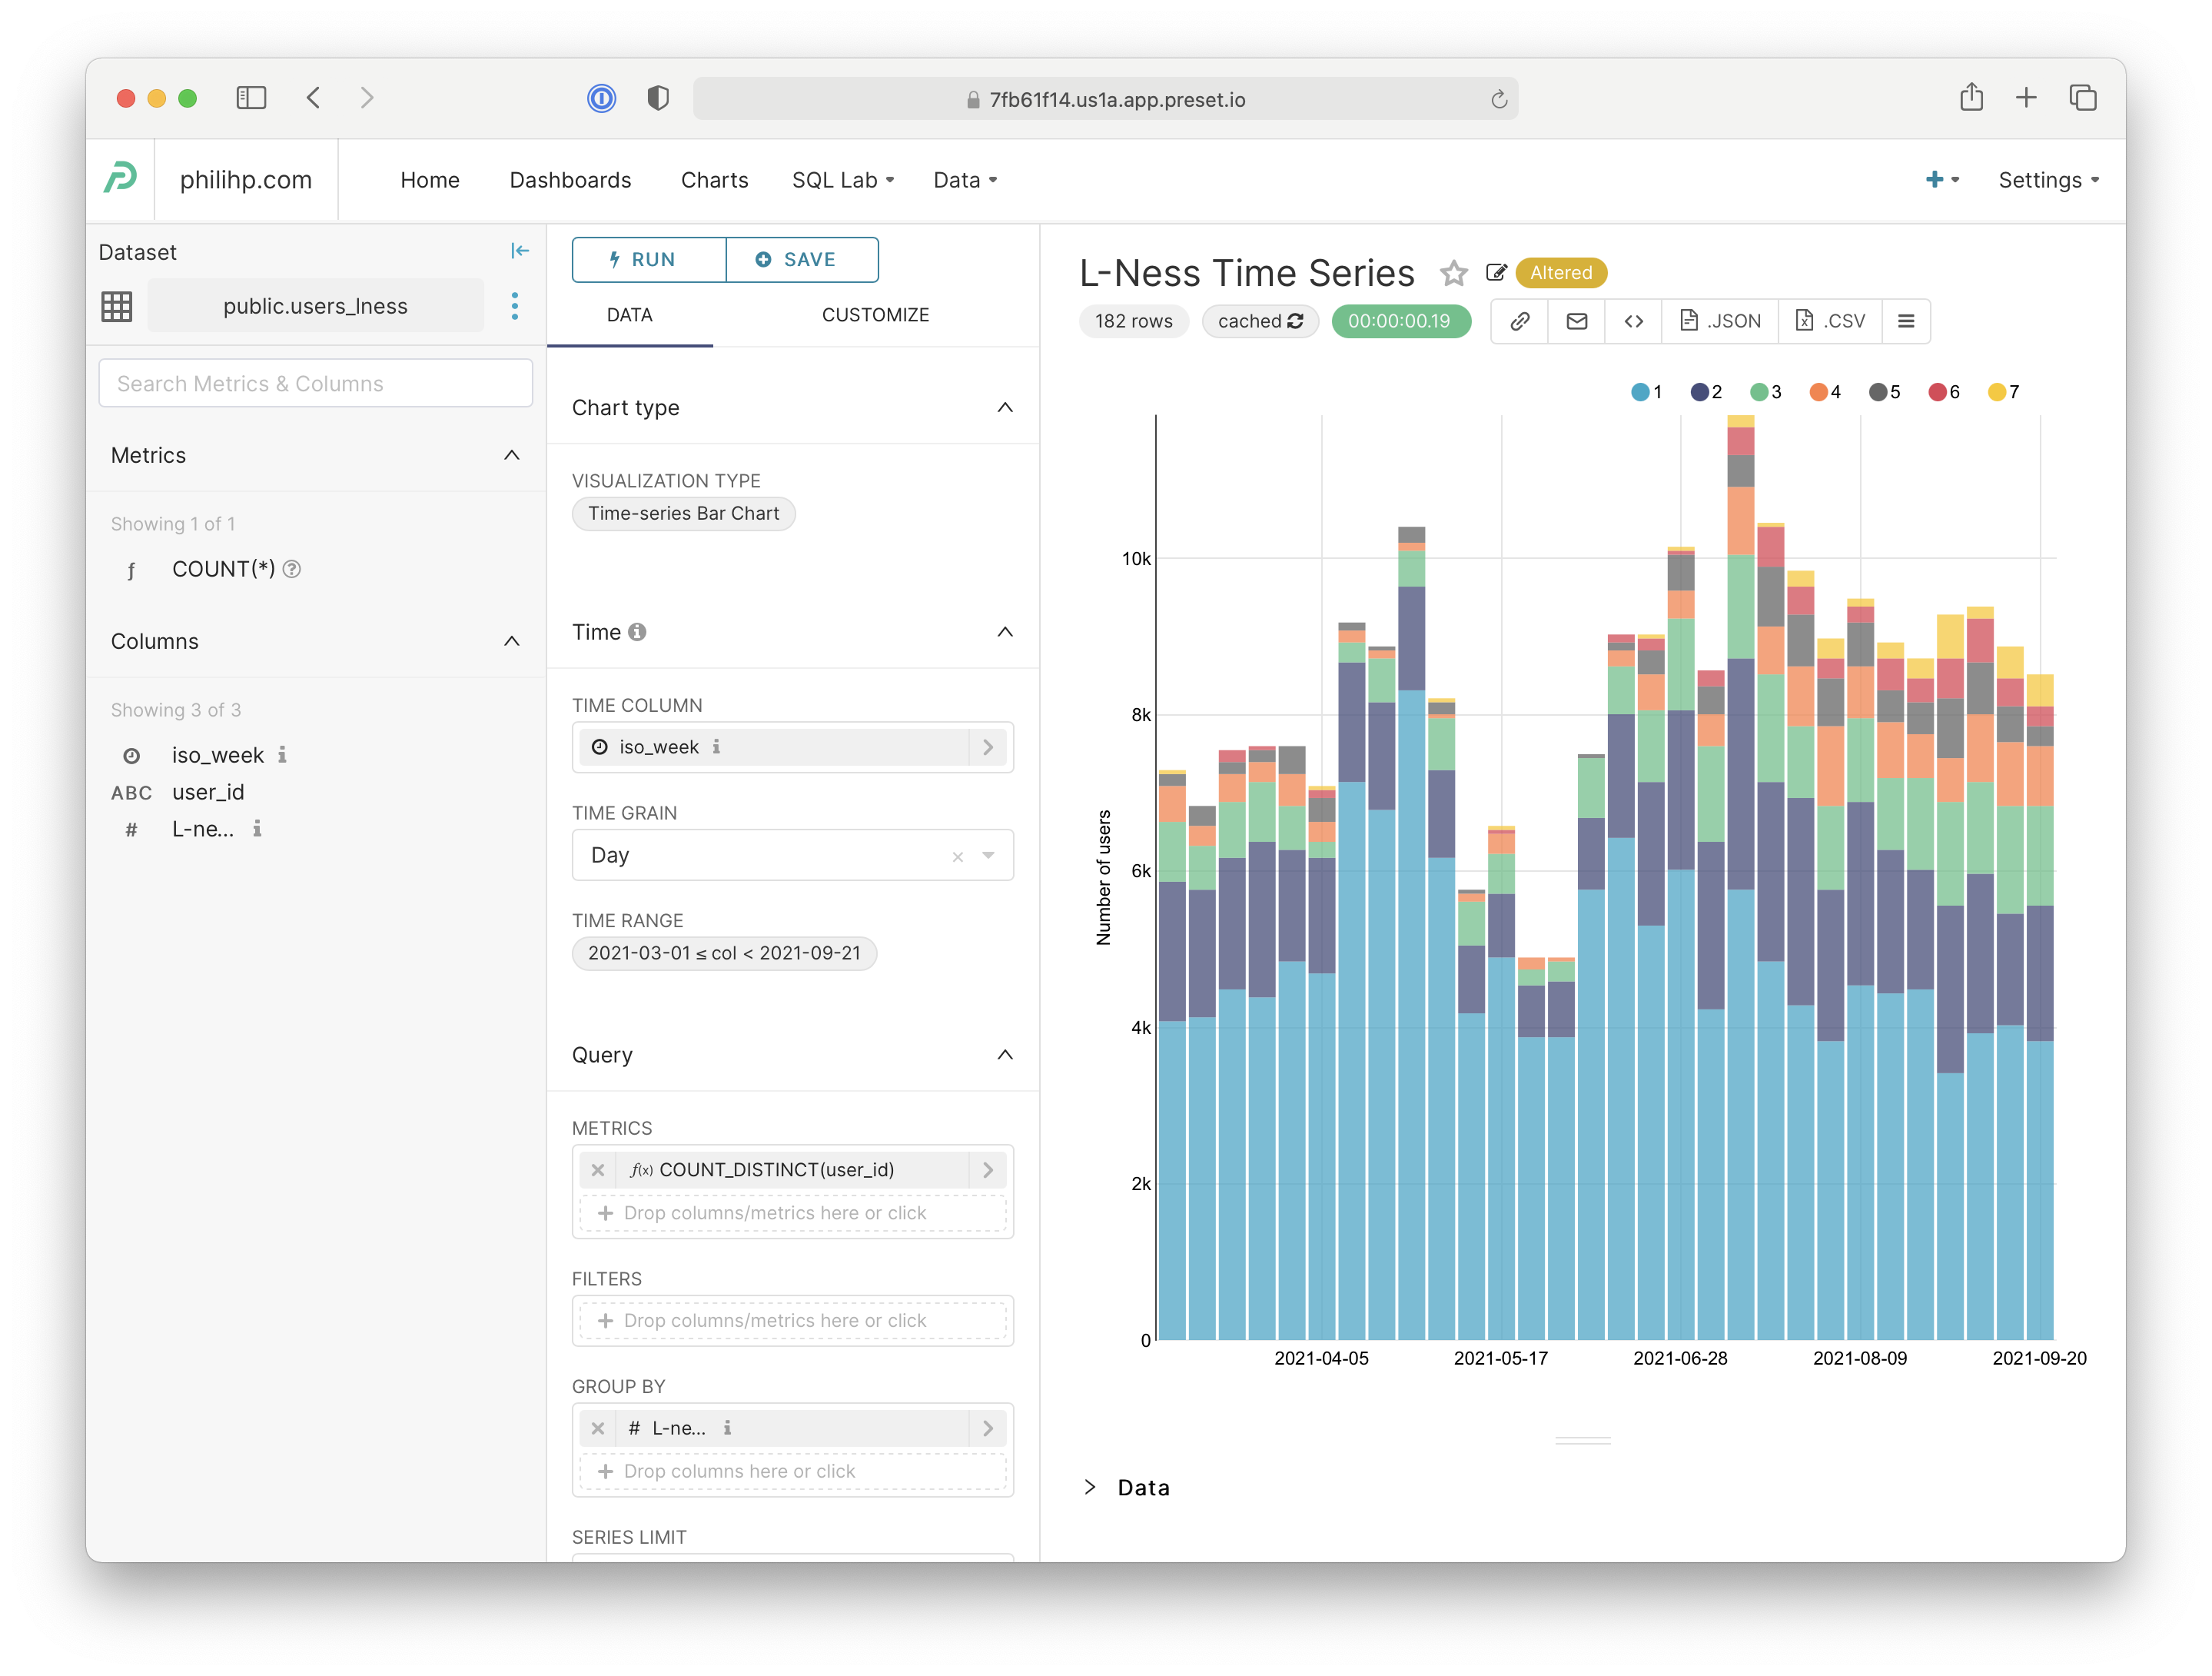
To calculate this with an SQL query going to Postgres, I took advantage of the ISO Week Date formatting built in, otherwise the week that wraps around the year marker would break up my metrics.
To calculate this, my first attempt looked something like this:
SELECT
    e.user_id,
    COUNT(DISTINCT EXTRACT(DAYS FROM CURRENT_TIMESTAMP - e.sent_at))
  FROM event e
  WHERE e.sent_at > CURRENT_TIMESTAMP - INTERVAL '7 days'
  GROUP BY e.user_id
Which says for every user, give me all of the events from the last 7 days, and then extract the number of days old each event is, and then count the number of distinct number of days there are. But this was a mistake because I misunderstood two things:
- The week window always begins on Monday, rather than having a rolling last-7-days. The week starts every week on Monday. If it is currently Wednesday, the maximum Lness for a user this week is 3, and tomorrow it is 4. Likewise, you will only see 7’s on Sunday.
- I want to see historically how the Lness was in prior weeks.
Understanding these two things, my next query looked like this:
SELECT
    e.user_id
    TO_DATE(TO_CHAR(e.sent_at, 'IYYY-"W"IW'), 'IYYY-"W"IW') AS iso_week,
    COUNT(DISTINCT TO_CHAR(e.sent_at, 'ID')) AS lness
  FROM event e
    WHERE e.user_id IS NOT NULL
  GROUP BY 1, 2
Which says _for every combination of user_id and iso-week from the sent_at (forget about the day of week and time), convert the sent_at to just the day of the week, and tell me how many distinct days of week there are for every combination of the first two things I queried.
| user_id | iso_weeek | lness |
|---|---|---|
| 40232 | 2021-09-19 | 1 |
| 40232 | 2021-09-26 | 3 |
| 40232 | 2021-10-03 | 2 |
| 42781 | 2021-09-26 | 1 |
| 41301 | 2021-09-26 | 7 |
| 41301 | 2021-10-03 | 6 |
| … | … | … |
The data is now in a useful proper cardinality and schema for presentation. I prefer Superset because it’s free, although Preset is a very affordable hosted alternative. The above query will probably take a while to run (it took me about 25 seconds), and Preset will attempt to cache data returned. With a Time-series Bar Chart configured as shown on the left, it shows me a graph like I had envisioned.